mirror of
https://github.com/radzenhq/radzen-blazor.git
synced 2026-02-04 05:35:44 +00:00
Tooltip following wrong RadzenAreaSeries #361
Closed
opened 2026-01-29 17:36:04 +00:00 by claunia
·
3 comments
No Branch/Tag Specified
master
accessibility
spreadsheet
responsive-ordinal-scale
v8.7.5
v8.7.4
8.7.3
v8.7.2
v8.7.1
v8.7.0
v8.6.5
v8.6.4
v8.6.3
v8.6.2
v8.6.1
v8.6.0
v8.5.2
v8.5.1
v8.5.0
v8.4.3
v8.4.2
v8.4.1
v8.4.0
v8.3.9
v8.3.8
v8.3.7
v8.3.6
v8.3.5
v8.3.4
v8.3.3
v8.3.2
v8.3.1
v8.3.0
v8.2.2
v8.2.1
v8.2.0
v8.1.8
v8.1.7
v8.1.6
v8.1.5
v8.1.4
v8.1.3
8.1.2
v8.1.1
v8.1.0
v8.0.4
v8.0.3
v8.0.2
v8.0.1
v8.0.0
v7.4.3
v7.4.2
v7.4.1
v7.4.0
v7.3.6
v7.3.5
v7.3.4
v7.3.3
v7.3.2
v7.3.1
v7.3.0
v7.2.3
v7.2.2
v7.2.1
v7.2.0
v7.1.8
v7.1.7
v7.1.6
v7.1.5
v7.1.4
v7.1.3
v7.1.2
v7.1.1
v7.1.0
v7.0.8
v7.0.7
v7.0.6
v7.0.5
v7.0.4
v7.0.3
v7.0.2
v7.0.1
v7.0.0
v6.6.4
v6.6.3
v6.6.2
v6.6.1
v6.6.0
v6.5.4
v6.5.2
v6.5.1
v6.5.0
v6.4.1
v6.4.0
v6.3.4
v6.3.3
v6.3.2
v6.3.1
v6.3.0
v6.2.10
v6.2.9
v6.2.8
v6.2.7
v6.2.6
v6.2.5
v6.2.4
v6.2.3
v6.2.2
v6.2.1
v6.2.0
v6.1.6
v6.1.5
v6.1.4
v6.1.3
v6.1.2
v6.1.1
v6.1.0
v6.0.20
v6.0.19
v6.0.18
v6.0.17
v6.0.16
v6.0.15
v6.0.14
v6.0.13
v6.0.12
v6.0.11
v6.0.10
v6.0.9
v6.0.8
v6.0.7
v6.0.6
v6.0.5
v6.0.4
v6.0.3
v6.0.2
v6.0.1
v6.0.0
v5.9.9
v5.9.8
v5.9.7
v5.9.6
v5.9.5
v5.9.4
v5.9.3
v5.9.2
v5.9.1
v5.9.0
v5.8.0
v5.7.10
v5.7.9
v5.7.8
v5.7.7
v5.7.6
v5.7.5
v5.7.4
v5.7.3
v5.7.2
v5.7.1
v5.7.0
v5.6.15
v5.6.14
v5.6.13
v5.6.12
v5.6.11
v5.6.10
v5.6.9
v5.6.8
v5.6.7
v5.6.6
v5.6.5
v5.6.4
v5.6.3
v5.6.2
v5.6.1
v5.6.0
v5.5.5
v5.5.4
v5.5.3
v5.5.2
v5.5.1
v5.5.0
v5.4.0
v5.3.5
v5.3.3
v5.3.2
v5.3.1
v5.3.0
v5.2.12
v5.2.11
v5.2.10
v5.2.9
v5.2.8
v5.2.7
v5.2.6
v5.2.5
5.2.4
v5.2.3
v5.2.2
v5.2.1
v5.2.0
v5.1.11
v5.1.10
v5.1.9
v5.1.8
v5.1.7
v5.1.6
v5.1.5
v5.1.4
v5.1.3
v5.1.2
v5.1.1
v5.1.0
v5.0.9
v5.0.8
v5.0.7
v5.0.6
v5.0.5
v5.0.4
v5.0.3
v5.0.2
v5.0.1
v5.0.0
v4.34.3
v4.34.2
v4.34.1
v4.34.0
v4.33.3
v4.33.2
v4.33.1
v4.33.0
v4.32.11
v4.32.10
v4.32.9
v4.32.8
v4.32.7
v4.32.5
v4.32.4
v4.32.3
v4.32.2
v4.32.1
v4.32.0
v4.31.7
v4.31.6
v4.31.5
v4.31.4
v4.31.3
v4.31.2
v4.31.1
v4.31.0
v4.30.3
v4.30.2
v4.30.1
v4.30.0
v4.29.9
v4.29.8
v4.29.7
v4.29.6
v4.29.5
v4.29.4
v4.29.3
v4.29.2
v4.29.1
v4.29.0
v4.28.11
v4.28.9
v4.28.8
v4.28.7
v4.28.6
v4.28.5
v4.28.4
v4.28.3
v4.28.2
v4.28.1
v4.28.0
v4.27.1
v4.27.0
v4.26.1
v4.26.0
v4.25.12
v4.25.11
v4.25.10
v4.25.9
v4.25.8
v4.25.7
v4.25.6
v4.25.5
v4.25.4
v4.25.3
v4.25.2
v4.25.1
v4.25.0
v4.24.7
v4.24.6
v4.24.5
v4.24.4
v4.24.3
v4.24.2
v4.24.1
v4.24.0
v4.23.9
v4.23.8
v4.23.7
v4.23.6
v4.23.5
v4.23.3
v4.23.4
v4.23.2
v4.23.1
v4.23.0
v4.22.1
v4.22.0
v4.21.4
v4.21.3
v4.21.2
v4.21.1
v4.21.0
v4.20.4
v4.20.3
v4.20.2
v4.20.1
v4.20.0
v4.19.1
v4.19.0
v4.18.1
v4.18.0
v4.17.1
v4.17.0
v4.16.4
v4.16.3
v4.16.2
v4.16.1
v4.16.0
v4.15.14
v4.15.13
v4.15.12
v4.15.11
v4.15.10
v4.15.9
v4.15.8
v4.15.7
v4.15.6
v4.15.5
v4.15.4
v4.15.3
v4.15.2
v4.15.1
v4.15.0
v4.14.4
v4.14.3
v4.14.2
v4.14.1
v4.14.0
v4.13.6
v4.13.5
v4.13.3
v4.13.4
v4.13.2
v4.13.1
v4.13.0
v4.12.1
v4.12.0
v4.11.2
v4.11.1
v4.11.0
v4.10.4
v4.10.3
v4.10.2
v4.10.1
v4.10.0
v4.9.2
v4.9.1
v4.9.0
v4.8.4
v4.8.3
v4.8.2
v4.8.1
v4.8.0
v4.7.14
v4.7.13
v4.7.12
v4.7.11
v4.7.10
v4.7.9
v4.7.8
v4.7.7
v4.7.6
v4.7.5
v4.7.4
v4.7.3
v4.7.2
v4.7.1
v4.7.0
v4.6.7
v4.6.6
v4.6.5
v4.6.4
v4.6.3
v4.6.2
v4.6.1
v4.6.0
v4.5.3
v4.5.2
v4.5.1
v4.5.0
v4.4.9
v4.4.8
v4.4.7
v4.4.6
v4.4.5
v4.4.4
v4.4.3
v4.4.2
v4.4.1
v4.4.0
v4.3.10
v4.3.9
v4.3.8
v4.3.7
4.3.6
v4.3.5
v4.3.4
v4.3.3
v4.3.2
v4.3.0
v4.3.1
v4.2.3
v4.2.2
v4.2.1
v4.2.0
v4.1.14
v4.1.15
v4.1.13
v4.1.12
v4.1.11
v4.1.10
v4.1.9
v4.1.8
v4.1.7
v4.1.6
v4.1.5
v4.1.4
v4.1.3
v4.1.2
v4.1.1
v4.1.0
v4.0.0
v3.20.12
v3.20.11
v3.20.10
v3.20.9
v3.20.8
v3.20.7
v3.20.6
v3.20.5
v3.20.4
v3.20.3
v3.20.2
v3.20.1
v3.20.0
v3.19.12
v3.19.11
v3.19.10
v3.19.9
v3.19.8
v3.19.7
v3.19.6
v3.19.5
v3.19.4
v3.19.3
v3.19.2
v3.19.1
v3.19.0
v3.18.16
v3.18.15
v3.18.14
v3.18.13
v3.18.12
v3.18.11
v3.18.10
v3.18.9
v3.18.8
v3.18.7
v3.18.6
v3.18.5
v3.18.4
v3.18.3
v3.18.2
v3.18.1
v3.18.0
v3.17.3
v3.17.1
v3.17.2
v3.17.0
v3.16.7
v3.16.6
v3.16.5
v3.16.4
v3.16.3
v3.16.2
v3.16.1
v3.16.0
v3.15.6
v3.15.5
v3.15.4
v3.15.3
v3.15.2
v3.15.1
v3.15.0
v3.14.12
v3.14.11
v3.14.10
v3.14.9
v3.14.8
v3.14.7
v3.14.6
v3.14.5
v3.14.4
v3.14.3
v3.14.2
v3.14.1
v3.14.0
v3.13.12
v3.13.11
v3.13.10
v3.13.9
v3.13.8
v3.13.7
v3.13.6
v3.13.5
v3.13.4
v3.13.3
v3.13.2
v3.13.1
v3.13.0
v3.12.5
v3.12.4
v3.12.2
v3.12.3
v3.12.1
v3.12.0
v3.11.12
v3.11.11
v3.11.10
v3.11.9
v3.11.8
v3.11.7
v3.11.6
v3.11.5
v3.11.4
v3.11.3
v3.11.2
v3.11.1
v3.11.0
v3.10.2
v3.10.1
v3.10.0
v3.9.10
v3.9.9
v3.9.8
v3.9.7
v3.9.6
v3.9.5
v3.9.4
v3.9.3
v3.9.2
v3.9.1
v3.9.0
v3.8.2
v3.8.1
v3.8.0
v3.7.3
v3.7.2
v3.7.1
v3.7.0
v3.6.8
v3.6.7
v3.6.6
v3.6.5
v3.6.4
v3.6.3
v3.6.2
v3.6.1
v3.6.0
v3.5.3
v3.5.2
v3.5.1
v3.5.0
v3.4.2
v3.4.1
v3.4.0
v3.3.2
v3.3.1
v3.3.0
v3.2.9
v3.2.8
v3.2.7
v3.2.6
v3.2.4
v3.2.3
v3.2.2
v3.2.1
v3.2.0
v3.1.11
v3.1.10
v3.1.9
v3.1.8
v3.1.7
v3.1.6
v3.1.5
v3.1.4
v3.1.3
v3.1.2
v3.1.1
v3.1.0
v3.0.10
v3.0.9
v3.0.8
v3.0.7
v3.0.5
v3.0.4
v3.0.3
v3.0.2
v3.0.1
v3.0.0
No Label
Milestone
No items
No Milestone
Projects
Clear projects
No project
Notifications
Due Date
No due date set.
Dependencies
No dependencies set.
Reference: starred/radzen-blazor#361
Reference in New Issue
Block a user
Blocking a user prevents them from interacting with repositories, such as opening or commenting on pull requests or issues. Learn more about blocking a user.
Delete Branch "%!s()"
Deleting a branch is permanent. Although the deleted branch may continue to exist for a short time before it actually gets removed, it CANNOT be undone in most cases. Continue?
Originally created by @eharbitz on GitHub (Apr 6, 2022).
name: Bug report
about: Create a report to help us improve
title: Tooltip following wrong RadzenAreaSeries
labels: ''
assignees: ''
Describe the bug
When having several
RadzenAreaSeriesin oneRadzenChart, the tooltip does not show data for the AreaSeries currently being hovered over.To Reproduce
Steps to reproduce the behavior:
Expected behavior
See a Tooltip with data for the AreaSeries currently being hovered.
Screenshots
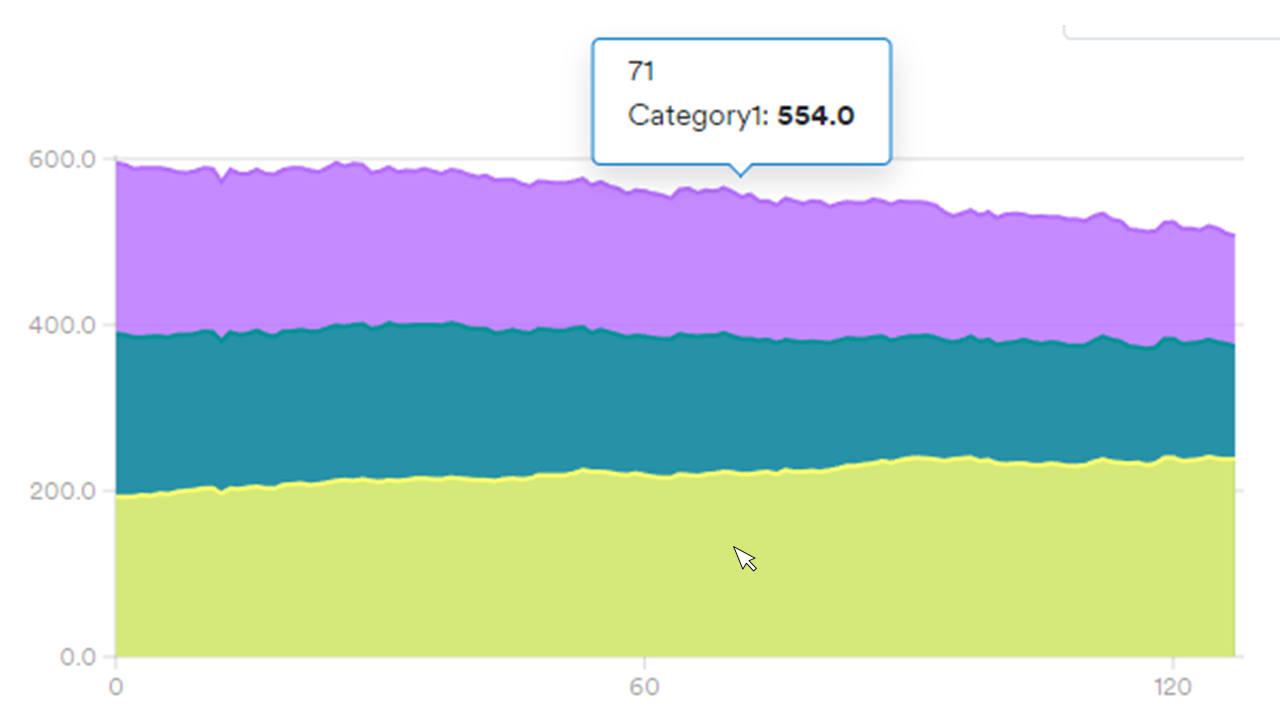
Image caption: While the mouse is hovering the yellow area, the tooltip follows the purple area.
Desktop (please complete the following information):
Additional context
Seems to be the same problem with RadzenLineSeries when overlapping AreaSeries as well. Changing the RenderingOrder does not solve the problem. It might seem like the Tooltip is stuck with the wrong RenderingOrder, i.e. the Tooltip is not following the Series rendered at top.
@akorchev commented on GitHub (Apr 6, 2022):
I can't reproduce it in our online demo which uses a similar configuration: https://blazor.radzen.com/area-chart
@eharbitz commented on GitHub (Apr 6, 2022):
Thanks for the fast reply.
It seems the order matters when adding the
RadzenAreaSeries.If you change the order in the demo you linked you get the same problem.
That is, instead of
<RadzenAreaSeries Smooth="@smooth" Data="@revenue2019" CategoryProperty="Date" Title="2019" ValueProperty="Revenue" RenderingOrder="1"> </RadzenAreaSeries><RadzenAreaSeries Smooth="@smooth" Data="@revenue2020" CategoryProperty="Date" Title="2020" LineType="LineType.Dashed" ValueProperty="Revenue"> </RadzenAreaSeries>use this (with 2019 and 2020 data switched)
<RadzenAreaSeries Smooth="@smooth" Data="@revenue2020" CategoryProperty="Date" Title="2020" LineType="LineType.Dashed" ValueProperty="Revenue"> </RadzenAreaSeries><RadzenAreaSeries Smooth="@smooth" Data="@revenue2019" CategoryProperty="Date" Title="2019" ValueProperty="Revenue" RenderingOrder="1"> </RadzenAreaSeries>@akorchev commented on GitHub (Apr 6, 2022):
Maybe we have to sort the series by RenderingOrder before checking where the tooltip is. Right now it is in both series technically so we have to use something else to determine which one is on top.