mirror of
https://github.com/radzenhq/radzen-blazor.git
synced 2026-07-08 18:16:08 +00:00
Faster graphs in Blazor Server #365
Closed
opened 2026-01-29 17:36:08 +00:00 by claunia
·
2 comments
No Branch/Tag Specified
master
daterangepicker
trim
v11.1.2
v11.1.1
v11.1.0
v11.0.5
v11.0.4
v11.0.3
v11.0.2
v11.0.1
v11.0.0
v10.4.8
v10.4.9
v10.4.7
v10.4.6
v10.4.5
v10.4.4
v10.4.3
v10.4.2
v10.4.1
v10.4.0
v10.3.2
v10.3.1
v10.3.0
v10.2.3
v10.2.2
v10.2.1
v10.2.0
v10.1.0
v10.0.7
v10.0.6
v10.0.5
v10.0.4
v10.0.3
v10.0.2
v10.0.1
v10.0.0
v9.1.0
v9.0.8
v9.0.7
v9.0.6
v9.0.5
v9.0.4
v9.0.3
v9.0.2
v9.0.1
v9.0.0
v8.7.5
v8.7.4
8.7.3
v8.7.2
v8.7.1
v8.7.0
v8.6.5
v8.6.4
v8.6.3
v8.6.2
v8.6.1
v8.6.0
v8.5.2
v8.5.1
v8.5.0
v8.4.3
v8.4.2
v8.4.1
v8.4.0
v8.3.9
v8.3.8
v8.3.7
v8.3.6
v8.3.5
v8.3.4
v8.3.3
v8.3.2
v8.3.1
v8.3.0
v8.2.2
v8.2.1
v8.2.0
v8.1.8
v8.1.7
v8.1.6
v8.1.5
v8.1.4
v8.1.3
8.1.2
v8.1.1
v8.1.0
v8.0.4
v8.0.3
v8.0.2
v8.0.1
v8.0.0
v7.4.3
v7.4.2
v7.4.1
v7.4.0
v7.3.6
v7.3.5
v7.3.4
v7.3.3
v7.3.2
v7.3.1
v7.3.0
v7.2.3
v7.2.2
v7.2.1
v7.2.0
v7.1.8
v7.1.7
v7.1.6
v7.1.5
v7.1.4
v7.1.3
v7.1.2
v7.1.1
v7.1.0
v7.0.8
v7.0.7
v7.0.6
v7.0.5
v7.0.4
v7.0.3
v7.0.2
v7.0.1
v7.0.0
v6.6.4
v6.6.3
v6.6.2
v6.6.1
v6.6.0
v6.5.4
v6.5.2
v6.5.1
v6.5.0
v6.4.1
v6.4.0
v6.3.4
v6.3.3
v6.3.2
v6.3.1
v6.3.0
v6.2.10
v6.2.9
v6.2.8
v6.2.7
v6.2.6
v6.2.5
v6.2.4
v6.2.3
v6.2.2
v6.2.1
v6.2.0
v6.1.6
v6.1.5
v6.1.4
v6.1.3
v6.1.2
v6.1.1
v6.1.0
v6.0.20
v6.0.19
v6.0.18
v6.0.17
v6.0.16
v6.0.15
v6.0.14
v6.0.13
v6.0.12
v6.0.11
v6.0.10
v6.0.9
v6.0.8
v6.0.7
v6.0.6
v6.0.5
v6.0.4
v6.0.3
v6.0.2
v6.0.1
v6.0.0
v5.9.9
v5.9.8
v5.9.7
v5.9.6
v5.9.5
v5.9.4
v5.9.3
v5.9.2
v5.9.1
v5.9.0
v5.8.0
v5.7.10
v5.7.9
v5.7.8
v5.7.7
v5.7.6
v5.7.5
v5.7.4
v5.7.3
v5.7.2
v5.7.1
v5.7.0
v5.6.15
v5.6.14
v5.6.13
v5.6.12
v5.6.11
v5.6.10
v5.6.9
v5.6.8
v5.6.7
v5.6.6
v5.6.5
v5.6.4
v5.6.3
v5.6.2
v5.6.1
v5.6.0
v5.5.5
v5.5.4
v5.5.3
v5.5.2
v5.5.1
v5.5.0
v5.4.0
v5.3.5
v5.3.3
v5.3.2
v5.3.1
v5.3.0
v5.2.12
v5.2.11
v5.2.10
v5.2.9
v5.2.8
v5.2.7
v5.2.6
v5.2.5
5.2.4
v5.2.3
v5.2.2
v5.2.1
v5.2.0
v5.1.11
v5.1.10
v5.1.9
v5.1.8
v5.1.7
v5.1.6
v5.1.5
v5.1.4
v5.1.3
v5.1.2
v5.1.1
v5.1.0
v5.0.9
v5.0.8
v5.0.7
v5.0.6
v5.0.5
v5.0.4
v5.0.3
v5.0.2
v5.0.1
v5.0.0
v4.34.3
v4.34.2
v4.34.1
v4.34.0
v4.33.3
v4.33.2
v4.33.1
v4.33.0
v4.32.11
v4.32.10
v4.32.9
v4.32.8
v4.32.7
v4.32.5
v4.32.4
v4.32.3
v4.32.2
v4.32.1
v4.32.0
v4.31.7
v4.31.6
v4.31.5
v4.31.4
v4.31.3
v4.31.2
v4.31.1
v4.31.0
v4.30.3
v4.30.2
v4.30.1
v4.30.0
v4.29.9
v4.29.8
v4.29.7
v4.29.6
v4.29.5
v4.29.4
v4.29.3
v4.29.2
v4.29.1
v4.29.0
v4.28.11
v4.28.9
v4.28.8
v4.28.7
v4.28.6
v4.28.5
v4.28.4
v4.28.3
v4.28.2
v4.28.1
v4.28.0
v4.27.1
v4.27.0
v4.26.1
v4.26.0
v4.25.12
v4.25.11
v4.25.10
v4.25.9
v4.25.8
v4.25.7
v4.25.6
v4.25.5
v4.25.4
v4.25.3
v4.25.2
v4.25.1
v4.25.0
v4.24.7
v4.24.6
v4.24.5
v4.24.4
v4.24.3
v4.24.2
v4.24.1
v4.24.0
v4.23.9
v4.23.8
v4.23.7
v4.23.6
v4.23.5
v4.23.3
v4.23.4
v4.23.2
v4.23.1
v4.23.0
v4.22.1
v4.22.0
v4.21.4
v4.21.3
v4.21.2
v4.21.1
v4.21.0
v4.20.4
v4.20.3
v4.20.2
v4.20.1
v4.20.0
v4.19.1
v4.19.0
v4.18.1
v4.18.0
v4.17.1
v4.17.0
v4.16.4
v4.16.3
v4.16.2
v4.16.1
v4.16.0
v4.15.14
v4.15.13
v4.15.12
v4.15.11
v4.15.10
v4.15.9
v4.15.8
v4.15.7
v4.15.6
v4.15.5
v4.15.4
v4.15.3
v4.15.2
v4.15.1
v4.15.0
v4.14.4
v4.14.3
v4.14.2
v4.14.1
v4.14.0
v4.13.6
v4.13.5
v4.13.3
v4.13.4
v4.13.2
v4.13.1
v4.13.0
v4.12.1
v4.12.0
v4.11.2
v4.11.1
v4.11.0
v4.10.4
v4.10.3
v4.10.2
v4.10.1
v4.10.0
v4.9.2
v4.9.1
v4.9.0
v4.8.4
v4.8.3
v4.8.2
v4.8.1
v4.8.0
v4.7.14
v4.7.13
v4.7.12
v4.7.11
v4.7.10
v4.7.9
v4.7.8
v4.7.7
v4.7.6
v4.7.5
v4.7.4
v4.7.3
v4.7.2
v4.7.1
v4.7.0
v4.6.7
v4.6.6
v4.6.5
v4.6.4
v4.6.3
v4.6.2
v4.6.1
v4.6.0
v4.5.3
v4.5.2
v4.5.1
v4.5.0
v4.4.9
v4.4.8
v4.4.7
v4.4.6
v4.4.5
v4.4.4
v4.4.3
v4.4.2
v4.4.1
v4.4.0
v4.3.10
v4.3.9
v4.3.8
v4.3.7
4.3.6
v4.3.5
v4.3.4
v4.3.3
v4.3.2
v4.3.0
v4.3.1
v4.2.3
v4.2.2
v4.2.1
v4.2.0
v4.1.14
v4.1.15
v4.1.13
v4.1.12
v4.1.11
v4.1.10
v4.1.9
v4.1.8
v4.1.7
v4.1.6
v4.1.5
v4.1.4
v4.1.3
v4.1.2
v4.1.1
v4.1.0
v4.0.0
v3.20.12
v3.20.11
v3.20.10
v3.20.9
v3.20.8
v3.20.7
v3.20.6
v3.20.5
v3.20.4
v3.20.3
v3.20.2
v3.20.1
v3.20.0
v3.19.12
v3.19.11
v3.19.10
v3.19.9
v3.19.8
v3.19.7
v3.19.6
v3.19.5
v3.19.4
v3.19.3
v3.19.2
v3.19.1
v3.19.0
v3.18.16
v3.18.15
v3.18.14
v3.18.13
v3.18.12
v3.18.11
v3.18.10
v3.18.9
v3.18.8
v3.18.7
v3.18.6
v3.18.5
v3.18.4
v3.18.3
v3.18.2
v3.18.1
v3.18.0
v3.17.3
v3.17.1
v3.17.2
v3.17.0
v3.16.7
v3.16.6
v3.16.5
v3.16.4
v3.16.3
v3.16.2
v3.16.1
v3.16.0
v3.15.6
v3.15.5
v3.15.4
v3.15.3
v3.15.2
v3.15.1
v3.15.0
v3.14.12
v3.14.11
v3.14.10
v3.14.9
v3.14.8
v3.14.7
v3.14.6
v3.14.5
v3.14.4
v3.14.3
v3.14.2
v3.14.1
v3.14.0
v3.13.12
v3.13.11
v3.13.10
v3.13.9
v3.13.8
v3.13.7
v3.13.6
v3.13.5
v3.13.4
v3.13.3
v3.13.2
v3.13.1
v3.13.0
v3.12.5
v3.12.4
v3.12.2
v3.12.3
v3.12.1
v3.12.0
v3.11.12
v3.11.11
v3.11.10
v3.11.9
v3.11.8
v3.11.7
v3.11.6
v3.11.5
v3.11.4
v3.11.3
v3.11.2
v3.11.1
v3.11.0
v3.10.2
v3.10.1
v3.10.0
v3.9.10
v3.9.9
v3.9.8
v3.9.7
v3.9.6
v3.9.5
v3.9.4
v3.9.3
v3.9.2
v3.9.1
v3.9.0
v3.8.2
v3.8.1
v3.8.0
v3.7.3
v3.7.2
v3.7.1
v3.7.0
v3.6.8
v3.6.7
v3.6.6
v3.6.5
v3.6.4
v3.6.3
v3.6.2
v3.6.1
v3.6.0
v3.5.3
v3.5.2
v3.5.1
v3.5.0
v3.4.2
v3.4.1
v3.4.0
v3.3.2
v3.3.1
v3.3.0
v3.2.9
v3.2.8
v3.2.7
v3.2.6
v3.2.4
v3.2.3
v3.2.2
v3.2.1
v3.2.0
v3.1.11
v3.1.10
v3.1.9
v3.1.8
v3.1.7
v3.1.6
v3.1.5
v3.1.4
v3.1.3
v3.1.2
v3.1.1
v3.1.0
v3.0.10
v3.0.9
v3.0.8
v3.0.7
v3.0.5
v3.0.4
v3.0.3
v3.0.2
v3.0.1
v3.0.0
No Label
Milestone
No items
No Milestone
Projects
Clear projects
No project
Notifications
Due Date
No due date set.
Dependencies
No dependencies set.
Reference: starred/radzen-blazor#365
Reference in New Issue
Block a user
Blocking a user prevents them from interacting with repositories, such as opening or commenting on pull requests or issues. Learn more about blocking a user.
Delete Branch "%!s()"
Deleting a branch is permanent. Although the deleted branch may continue to exist for a short time before it actually gets removed, it CANNOT be undone in most cases. Continue?
Originally created by @eharbitz on GitHub (Apr 7, 2022).
Is your feature request related to a problem? Please describe.
When using RadzenAreaSeries with a lot of data, everything is very slow. Especially when hovering over the graph, the tooltip can lag up to several seconds behind the mouse movement.
Describe the solution you'd like
Faster graphs. Less data being sent back and forth between client and server. I don't have any insight for how the Blazor Radzen system works, but maybe a solution would be to run more/some things through Javascript interop?
Describe alternatives you've considered
Additional context
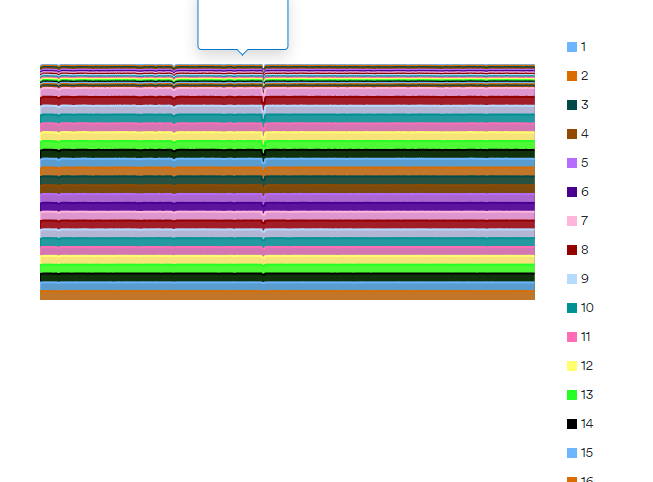
Image caption: Screenshot of a graph which is very slow. Looking at dev tools a lot of messages are sent between the client and server. (Tooltip and axis text is edited away in this screenshot)
@akorchev commented on GitHub (Apr 7, 2022):
You should probably use a JS library optimized for such data volume. Check Highcharts for example.
@eharbitz commented on GitHub (Apr 7, 2022):
Thanks :)