mirror of
https://github.com/radzenhq/radzen-blazor.git
synced 2026-02-04 05:35:44 +00:00
Negative Values in column chart #621
Open
opened 2026-01-29 17:40:24 +00:00 by claunia
·
0 comments
No Branch/Tag Specified
master
accessibility
spreadsheet
responsive-ordinal-scale
v8.7.5
v8.7.4
8.7.3
v8.7.2
v8.7.1
v8.7.0
v8.6.5
v8.6.4
v8.6.3
v8.6.2
v8.6.1
v8.6.0
v8.5.2
v8.5.1
v8.5.0
v8.4.3
v8.4.2
v8.4.1
v8.4.0
v8.3.9
v8.3.8
v8.3.7
v8.3.6
v8.3.5
v8.3.4
v8.3.3
v8.3.2
v8.3.1
v8.3.0
v8.2.2
v8.2.1
v8.2.0
v8.1.8
v8.1.7
v8.1.6
v8.1.5
v8.1.4
v8.1.3
8.1.2
v8.1.1
v8.1.0
v8.0.4
v8.0.3
v8.0.2
v8.0.1
v8.0.0
v7.4.3
v7.4.2
v7.4.1
v7.4.0
v7.3.6
v7.3.5
v7.3.4
v7.3.3
v7.3.2
v7.3.1
v7.3.0
v7.2.3
v7.2.2
v7.2.1
v7.2.0
v7.1.8
v7.1.7
v7.1.6
v7.1.5
v7.1.4
v7.1.3
v7.1.2
v7.1.1
v7.1.0
v7.0.8
v7.0.7
v7.0.6
v7.0.5
v7.0.4
v7.0.3
v7.0.2
v7.0.1
v7.0.0
v6.6.4
v6.6.3
v6.6.2
v6.6.1
v6.6.0
v6.5.4
v6.5.2
v6.5.1
v6.5.0
v6.4.1
v6.4.0
v6.3.4
v6.3.3
v6.3.2
v6.3.1
v6.3.0
v6.2.10
v6.2.9
v6.2.8
v6.2.7
v6.2.6
v6.2.5
v6.2.4
v6.2.3
v6.2.2
v6.2.1
v6.2.0
v6.1.6
v6.1.5
v6.1.4
v6.1.3
v6.1.2
v6.1.1
v6.1.0
v6.0.20
v6.0.19
v6.0.18
v6.0.17
v6.0.16
v6.0.15
v6.0.14
v6.0.13
v6.0.12
v6.0.11
v6.0.10
v6.0.9
v6.0.8
v6.0.7
v6.0.6
v6.0.5
v6.0.4
v6.0.3
v6.0.2
v6.0.1
v6.0.0
v5.9.9
v5.9.8
v5.9.7
v5.9.6
v5.9.5
v5.9.4
v5.9.3
v5.9.2
v5.9.1
v5.9.0
v5.8.0
v5.7.10
v5.7.9
v5.7.8
v5.7.7
v5.7.6
v5.7.5
v5.7.4
v5.7.3
v5.7.2
v5.7.1
v5.7.0
v5.6.15
v5.6.14
v5.6.13
v5.6.12
v5.6.11
v5.6.10
v5.6.9
v5.6.8
v5.6.7
v5.6.6
v5.6.5
v5.6.4
v5.6.3
v5.6.2
v5.6.1
v5.6.0
v5.5.5
v5.5.4
v5.5.3
v5.5.2
v5.5.1
v5.5.0
v5.4.0
v5.3.5
v5.3.3
v5.3.2
v5.3.1
v5.3.0
v5.2.12
v5.2.11
v5.2.10
v5.2.9
v5.2.8
v5.2.7
v5.2.6
v5.2.5
5.2.4
v5.2.3
v5.2.2
v5.2.1
v5.2.0
v5.1.11
v5.1.10
v5.1.9
v5.1.8
v5.1.7
v5.1.6
v5.1.5
v5.1.4
v5.1.3
v5.1.2
v5.1.1
v5.1.0
v5.0.9
v5.0.8
v5.0.7
v5.0.6
v5.0.5
v5.0.4
v5.0.3
v5.0.2
v5.0.1
v5.0.0
v4.34.3
v4.34.2
v4.34.1
v4.34.0
v4.33.3
v4.33.2
v4.33.1
v4.33.0
v4.32.11
v4.32.10
v4.32.9
v4.32.8
v4.32.7
v4.32.5
v4.32.4
v4.32.3
v4.32.2
v4.32.1
v4.32.0
v4.31.7
v4.31.6
v4.31.5
v4.31.4
v4.31.3
v4.31.2
v4.31.1
v4.31.0
v4.30.3
v4.30.2
v4.30.1
v4.30.0
v4.29.9
v4.29.8
v4.29.7
v4.29.6
v4.29.5
v4.29.4
v4.29.3
v4.29.2
v4.29.1
v4.29.0
v4.28.11
v4.28.9
v4.28.8
v4.28.7
v4.28.6
v4.28.5
v4.28.4
v4.28.3
v4.28.2
v4.28.1
v4.28.0
v4.27.1
v4.27.0
v4.26.1
v4.26.0
v4.25.12
v4.25.11
v4.25.10
v4.25.9
v4.25.8
v4.25.7
v4.25.6
v4.25.5
v4.25.4
v4.25.3
v4.25.2
v4.25.1
v4.25.0
v4.24.7
v4.24.6
v4.24.5
v4.24.4
v4.24.3
v4.24.2
v4.24.1
v4.24.0
v4.23.9
v4.23.8
v4.23.7
v4.23.6
v4.23.5
v4.23.3
v4.23.4
v4.23.2
v4.23.1
v4.23.0
v4.22.1
v4.22.0
v4.21.4
v4.21.3
v4.21.2
v4.21.1
v4.21.0
v4.20.4
v4.20.3
v4.20.2
v4.20.1
v4.20.0
v4.19.1
v4.19.0
v4.18.1
v4.18.0
v4.17.1
v4.17.0
v4.16.4
v4.16.3
v4.16.2
v4.16.1
v4.16.0
v4.15.14
v4.15.13
v4.15.12
v4.15.11
v4.15.10
v4.15.9
v4.15.8
v4.15.7
v4.15.6
v4.15.5
v4.15.4
v4.15.3
v4.15.2
v4.15.1
v4.15.0
v4.14.4
v4.14.3
v4.14.2
v4.14.1
v4.14.0
v4.13.6
v4.13.5
v4.13.3
v4.13.4
v4.13.2
v4.13.1
v4.13.0
v4.12.1
v4.12.0
v4.11.2
v4.11.1
v4.11.0
v4.10.4
v4.10.3
v4.10.2
v4.10.1
v4.10.0
v4.9.2
v4.9.1
v4.9.0
v4.8.4
v4.8.3
v4.8.2
v4.8.1
v4.8.0
v4.7.14
v4.7.13
v4.7.12
v4.7.11
v4.7.10
v4.7.9
v4.7.8
v4.7.7
v4.7.6
v4.7.5
v4.7.4
v4.7.3
v4.7.2
v4.7.1
v4.7.0
v4.6.7
v4.6.6
v4.6.5
v4.6.4
v4.6.3
v4.6.2
v4.6.1
v4.6.0
v4.5.3
v4.5.2
v4.5.1
v4.5.0
v4.4.9
v4.4.8
v4.4.7
v4.4.6
v4.4.5
v4.4.4
v4.4.3
v4.4.2
v4.4.1
v4.4.0
v4.3.10
v4.3.9
v4.3.8
v4.3.7
4.3.6
v4.3.5
v4.3.4
v4.3.3
v4.3.2
v4.3.0
v4.3.1
v4.2.3
v4.2.2
v4.2.1
v4.2.0
v4.1.14
v4.1.15
v4.1.13
v4.1.12
v4.1.11
v4.1.10
v4.1.9
v4.1.8
v4.1.7
v4.1.6
v4.1.5
v4.1.4
v4.1.3
v4.1.2
v4.1.1
v4.1.0
v4.0.0
v3.20.12
v3.20.11
v3.20.10
v3.20.9
v3.20.8
v3.20.7
v3.20.6
v3.20.5
v3.20.4
v3.20.3
v3.20.2
v3.20.1
v3.20.0
v3.19.12
v3.19.11
v3.19.10
v3.19.9
v3.19.8
v3.19.7
v3.19.6
v3.19.5
v3.19.4
v3.19.3
v3.19.2
v3.19.1
v3.19.0
v3.18.16
v3.18.15
v3.18.14
v3.18.13
v3.18.12
v3.18.11
v3.18.10
v3.18.9
v3.18.8
v3.18.7
v3.18.6
v3.18.5
v3.18.4
v3.18.3
v3.18.2
v3.18.1
v3.18.0
v3.17.3
v3.17.1
v3.17.2
v3.17.0
v3.16.7
v3.16.6
v3.16.5
v3.16.4
v3.16.3
v3.16.2
v3.16.1
v3.16.0
v3.15.6
v3.15.5
v3.15.4
v3.15.3
v3.15.2
v3.15.1
v3.15.0
v3.14.12
v3.14.11
v3.14.10
v3.14.9
v3.14.8
v3.14.7
v3.14.6
v3.14.5
v3.14.4
v3.14.3
v3.14.2
v3.14.1
v3.14.0
v3.13.12
v3.13.11
v3.13.10
v3.13.9
v3.13.8
v3.13.7
v3.13.6
v3.13.5
v3.13.4
v3.13.3
v3.13.2
v3.13.1
v3.13.0
v3.12.5
v3.12.4
v3.12.2
v3.12.3
v3.12.1
v3.12.0
v3.11.12
v3.11.11
v3.11.10
v3.11.9
v3.11.8
v3.11.7
v3.11.6
v3.11.5
v3.11.4
v3.11.3
v3.11.2
v3.11.1
v3.11.0
v3.10.2
v3.10.1
v3.10.0
v3.9.10
v3.9.9
v3.9.8
v3.9.7
v3.9.6
v3.9.5
v3.9.4
v3.9.3
v3.9.2
v3.9.1
v3.9.0
v3.8.2
v3.8.1
v3.8.0
v3.7.3
v3.7.2
v3.7.1
v3.7.0
v3.6.8
v3.6.7
v3.6.6
v3.6.5
v3.6.4
v3.6.3
v3.6.2
v3.6.1
v3.6.0
v3.5.3
v3.5.2
v3.5.1
v3.5.0
v3.4.2
v3.4.1
v3.4.0
v3.3.2
v3.3.1
v3.3.0
v3.2.9
v3.2.8
v3.2.7
v3.2.6
v3.2.4
v3.2.3
v3.2.2
v3.2.1
v3.2.0
v3.1.11
v3.1.10
v3.1.9
v3.1.8
v3.1.7
v3.1.6
v3.1.5
v3.1.4
v3.1.3
v3.1.2
v3.1.1
v3.1.0
v3.0.10
v3.0.9
v3.0.8
v3.0.7
v3.0.5
v3.0.4
v3.0.3
v3.0.2
v3.0.1
v3.0.0
No Label
Milestone
No items
No Milestone
Projects
Clear projects
No project
Notifications
Due Date
No due date set.
Dependencies
No dependencies set.
Reference: starred/radzen-blazor#621
Reference in New Issue
Block a user
Blocking a user prevents them from interacting with repositories, such as opening or commenting on pull requests or issues. Learn more about blocking a user.
Delete Branch "%!s()"
Deleting a branch is permanent. Although the deleted branch may continue to exist for a short time before it actually gets removed, it CANNOT be undone in most cases. Continue?
Originally created by @KenDarlingPAF on GitHub (Nov 7, 2022).
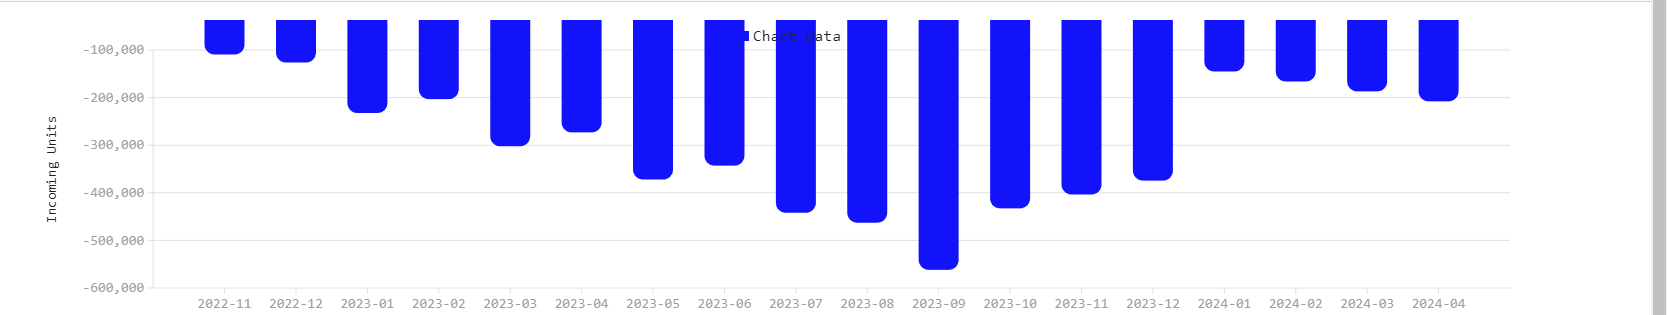
Describe the bug
For a column chart when all the columns contain negative values, it is not rendering correctly and the tool tip does not show. It also looks like the x axis is not displaying when all values are negative as well.
Expected behavior
The chart should display correctly showing the x axis as well as and the tool tips should show,
Screenshots
Desktop (please complete the following information):